06.07 标签
标签
1import numpy as np
2import matplotlib as mpl
3import matplotlib.pyplot as plt
4
5%matplotlib inline
legend() 函数被用来添加图像的标签,其主要相关的属性有:
- legend entry - 一个 legend 包含一个或多个 entry,一个 entry 对应一个 key 和一个 label
- legend key - marker 的标记
- legend label - key 的说明
- legend handle - 一个 entry 在图上对应的对象
使用 legend
调用 legend() 会自动获取当前的 Axes 对象,并且得到这些 handles 和 labels,相当于:
handles, labels = ax.get_legend_handles_labels()
ax.legend(handles, labels)
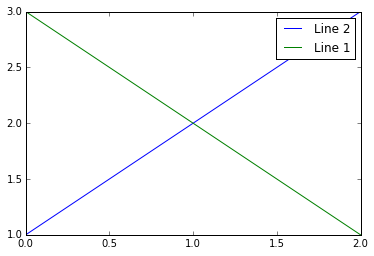
我们可以在函数中指定 handles 的参数:
1line_up, = plt.plot([1,2,3], label='Line 2')
2line_down, = plt.plot([3,2,1], label='Line 1')
3plt.legend(handles=[line_up, line_down])
4plt.show()
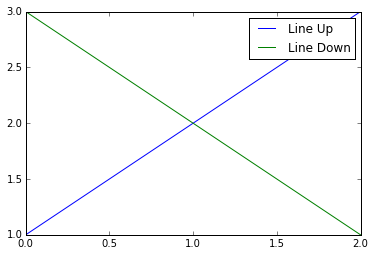
可以将 labels 作为参数输入 legend 函数:
1line_up, = plt.plot([1,2,3])
2line_down, = plt.plot([3,2,1])
3plt.legend([line_up, line_down], ['Line Up', 'Line Down'])
4plt.show()
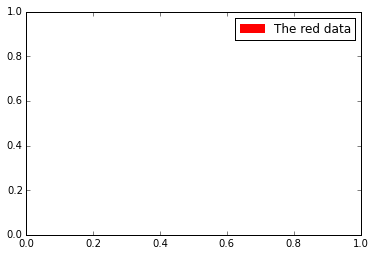
产生特殊形状的 marker key
有时我们可以产生一些特殊形状的 marker:
块状:
1import matplotlib.patches as mpatches
2
3red_patch = mpatches.Patch(color='red', label='The red data')
4plt.legend(handles=[red_patch])
5
6plt.show()
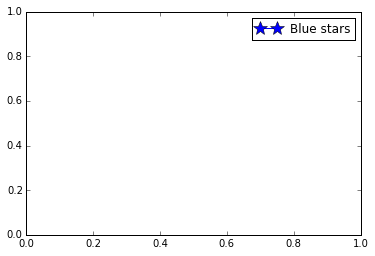
点线组合:
1import matplotlib.lines as mlines
2import matplotlib.pyplot as plt
3
4blue_line = mlines.Line2D([], [], color='blue', marker='*',
5                          markersize=15, label='Blue stars')
6plt.legend(handles=[blue_line])
7
8plt.show()
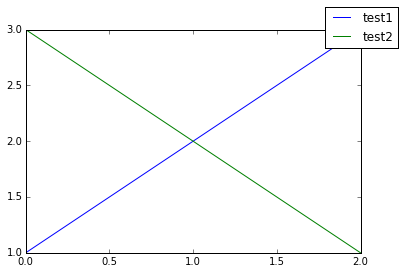
指定 legend 的位置
bbox_to_anchor 关键词可以指定 legend 放置的位置,例如放到图像的右上角:
1plt.plot([1,2,3], label="test1")
2plt.plot([3,2,1], label="test2")
3plt.legend(bbox_to_anchor=(1, 1),
4           bbox_transform=plt.gcf().transFigure)
5
6plt.show()
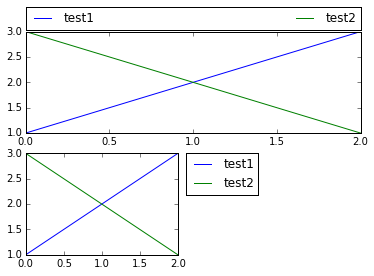
更复杂的用法:
 1plt.subplot(211)
 2plt.plot([1,2,3], label="test1")
 3plt.plot([3,2,1], label="test2")
 4# Place a legend above this legend, expanding itself to
 5# fully use the given bounding box.
 6plt.legend(bbox_to_anchor=(0., 1.02, 1., .102), loc=3,
 7           ncol=2, mode="expand", borderaxespad=0.)
 8
 9plt.subplot(223)
10plt.plot([1,2,3], label="test1")
11plt.plot([3,2,1], label="test2")
12# Place a legend to the right of this smaller figure.
13plt.legend(bbox_to_anchor=(1.05, 1), loc=2, borderaxespad=0.)
14
15plt.show()
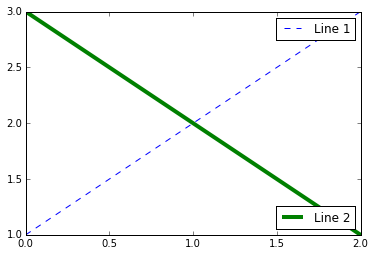
同一个 Axes 中的多个 legend
可以这样添加多个 legend:
 1line1, = plt.plot([1,2,3], label="Line 1", linestyle='--')
 2line2, = plt.plot([3,2,1], label="Line 2", linewidth=4)
 3
 4# Create a legend for the first line.
 5first_legend = plt.legend(handles=[line1], loc=1)
 6
 7# Add the legend manually to the current Axes.
 8ax = plt.gca().add_artist(first_legend)
 9
10# Create another legend for the second line.
11plt.legend(handles=[line2], loc=4)
12
13plt.show()
其中 loc 参数可以取 0-10 或者 字符串,表示放置的位置:
| loc string | loc code |
|---|---|
'best' |
0 |
'upper right' |
1 |
'upper left' |
2 |
'lower left' |
3 |
'lower right' |
4 |
'right' |
5 |
'center left' |
6 |
'center right' |
7 |
'lower center' |
8 |
'upper center' |
9 |
'center' |
10 |
更多用法
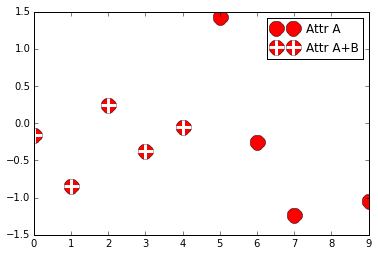
多个 handle 可以通过括号组合在一个 entry 中:
 1from numpy.random import randn
 2
 3z = randn(10)
 4
 5red_dot, = plt.plot(z, "ro", markersize=15)
 6# Put a white cross over some of the data.
 7white_cross, = plt.plot(z[:5], "w+", markeredgewidth=3, markersize=15)
 8
 9plt.legend([red_dot, (red_dot, white_cross)], ["Attr A", "Attr A+B"])
10
11plt.show()
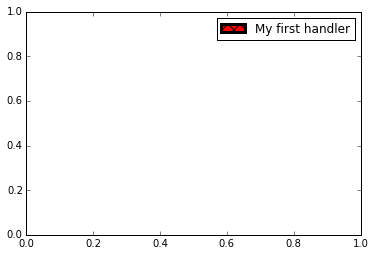
自定义 handle:
 1import matplotlib.pyplot as plt
 2import matplotlib.patches as mpatches
 3
 4class AnyObject(object):
 5    pass
 6
 7class AnyObjectHandler(object):
 8    def legend_artist(self, legend, orig_handle, fontsize, handlebox):
 9        x0, y0 = handlebox.xdescent, handlebox.ydescent
10        width, height = handlebox.width, handlebox.height
11        patch = mpatches.Rectangle([x0, y0], width, height, facecolor='red',
12                                   edgecolor='black', hatch='xx', lw=3,
13                                   transform=handlebox.get_transform())
14        handlebox.add_artist(patch)
15        return patch
16
17plt.legend([AnyObject()], ['My first handler'],
18           handler_map={AnyObject: AnyObjectHandler()})
19
20plt.show()
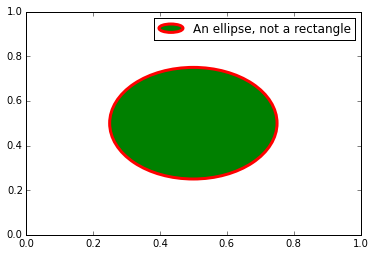
椭圆:
 1from matplotlib.legend_handler import HandlerPatch
 2import matplotlib.pyplot as plt
 3import matplotlib.patches as mpatches
 4
 5
 6class HandlerEllipse(HandlerPatch):
 7    def create_artists(self, legend, orig_handle,
 8                       xdescent, ydescent, width, height, fontsize, trans):
 9        center = 0.5 * width - 0.5 * xdescent, 0.5 * height - 0.5 * ydescent
10        p = mpatches.Ellipse(xy=center, width=width + xdescent,
11                             height=height + ydescent)
12        self.update_prop(p, orig_handle, legend)
13        p.set_transform(trans)
14        return [p]
15
16
17c = mpatches.Circle((0.5, 0.5), 0.25, facecolor="green",
18                    edgecolor="red", linewidth=3)
19plt.gca().add_patch(c)
20
21plt.legend([c], ["An ellipse, not a rectangle"],
22           handler_map={mpatches.Circle: HandlerEllipse()})
23
24plt.show()