06.06 注释
注释
使用文本框进行注释
先看一个简单的例子:
 1import numpy.random
 2import matplotlib.pyplot as plt
 3%matplotlib inline
 4
 5fig = plt.figure(1, figsize=(5,5))
 6fig.clf()
 7
 8ax = fig.add_subplot(111)
 9ax.set_aspect(1)
10
11x1 = -1 + numpy.random.randn(100)
12y1 = -1 + numpy.random.randn(100)
13x2 = 1. + numpy.random.randn(100)
14y2 = 1. + numpy.random.randn(100)
15
16ax.scatter(x1, y1, color="r")
17ax.scatter(x2, y2, color="g")
18
19# 加上两个文本框
20bbox_props = dict(boxstyle="round", fc="w", ec="0.5", alpha=0.9)
21ax.text(-2, -2, "Sample A", ha="center", va="center", size=20,
22        bbox=bbox_props)
23ax.text(2, 2, "Sample B", ha="center", va="center", size=20,
24        bbox=bbox_props)
25
26# 加上一个箭头文本框
27bbox_props = dict(boxstyle="rarrow", fc=(0.8,0.9,0.9), ec="b", lw=2)
28t = ax.text(0, 0, "Direction", ha="center", va="center", rotation=45,
29            size=15,
30            bbox=bbox_props)
31
32bb = t.get_bbox_patch()
33bb.set_boxstyle("rarrow", pad=0.6)
34
35ax.set_xlim(-4, 4)
36ax.set_ylim(-4, 4)
37
38plt.show()
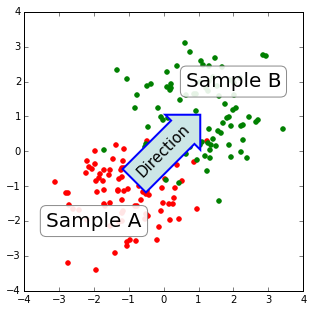
text() 函数接受 bbox 参数来绘制文本框。
1bbox_props = dict(boxstyle="rarrow,pad=0.3", fc="cyan", ec="b", lw=2)
2t = ax.text(0, 0, "Direction", ha="center", va="center", rotation=45,
3            size=15,
4            bbox=bbox_props)
可以这样来获取这个文本框,并对其参数进行修改:
1bb = t.get_bbox_patch()
2bb.set_boxstyle("rarrow", pad=0.6)
可用的文本框风格有:
| class | name | attrs |
|---|---|---|
| LArrow | larrow | pad=0.3 |
| RArrow | rarrow | pad=0.3 |
| Round | round | pad=0.3,rounding_size=None |
| Round4 | round4 | pad=0.3,rounding_size=None |
| Roundtooth | roundtooth | pad=0.3,tooth_size=None |
| Sawtooth | sawtooth | pad=0.3,tooth_size=None |
| Square | square | pad=0.3 |
 1import matplotlib.patches as mpatch
 2import matplotlib.pyplot as plt
 3
 4styles = mpatch.BoxStyle.get_styles()
 5
 6figheight = (len(styles)+.5)
 7fig1 = plt.figure(figsize=(4/1.5, figheight/1.5))
 8fontsize = 0.3 * 72
 9ax = fig1.add_subplot(111)
10
11for i, (stylename, styleclass) in enumerate(styles.items()):
12    ax.text(0.5, (float(len(styles)) - 0.5 - i)/figheight, stylename,
13              ha="center",
14              size=fontsize,
15              transform=fig1.transFigure,
16              bbox=dict(boxstyle=stylename, fc="w", ec="k"))
17
18# 去掉轴的显示
19ax.spines['right'].set_color('none')
20ax.spines['top'].set_color('none')
21ax.spines['left'].set_color('none')
22ax.spines['bottom'].set_color('none')
23plt.xticks([])
24plt.yticks([])
25
26plt.show()
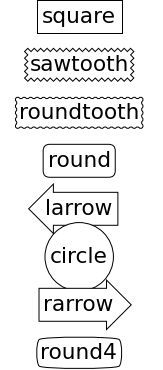
各个风格的文本框如上图所示。
使用箭头进行注释
 1plt.figure(1, figsize=(3,3))
 2ax = plt.subplot(111)
 3
 4ax.annotate("",
 5            xy=(0.2, 0.2), xycoords='data',
 6            xytext=(0.8, 0.8), textcoords='data',
 7            arrowprops=dict(arrowstyle="->",
 8                            connectionstyle="arc3"),
 9            )
10
11plt.show()
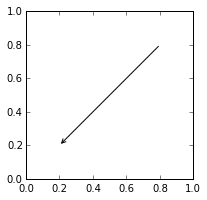
之前介绍了 annotate 中 xy, xycoords, xytext, textcoords 参数的含义,通常我们把 xy 设在 data 坐标系,把 xytext 设在 offset 即以注释点为原点的参考系。
箭头显示是可选的,用 arrowprops 参数来指定,接受一个字典作为参数。
不同类型的绘制箭头方式:
  1import matplotlib.pyplot as plt
  2import matplotlib.patches as mpatches
  3
  4x1, y1 = 0.3, 0.3
  5x2, y2 = 0.7, 0.7
  6
  7fig = plt.figure(1, figsize=(8,3))
  8fig.clf()
  9from mpl_toolkits.axes_grid.axes_grid import AxesGrid
 10from mpl_toolkits.axes_grid.anchored_artists import AnchoredText
 11
 12#from matplotlib.font_manager import FontProperties
 13
 14def add_at(ax, t, loc=2):
 15    fp = dict(size=10)
 16    _at = AnchoredText(t, loc=loc, prop=fp)
 17    ax.add_artist(_at)
 18    return _at
 19
 20
 21grid = AxesGrid(fig, 111, (1, 4), label_mode="1", share_all=True)
 22
 23grid[0].set_autoscale_on(False)
 24
 25ax = grid[0]
 26ax.plot([x1, x2], [y1, y2], ".")
 27el = mpatches.Ellipse((x1, y1), 0.3, 0.4, angle=30, alpha=0.2)
 28ax.add_artist(el)
 29ax.annotate("",
 30            xy=(x1, y1), xycoords='data',
 31            xytext=(x2, y2), textcoords='data',
 32            arrowprops=dict(arrowstyle="-", #linestyle="dashed",
 33                            color="0.5",
 34                            patchB=None,
 35                            shrinkB=0,
 36                            connectionstyle="arc3,rad=0.3",
 37                            ),
 38            )
 39
 40add_at(ax, "connect", loc=2)
 41
 42ax = grid[1]
 43ax.plot([x1, x2], [y1, y2], ".")
 44el = mpatches.Ellipse((x1, y1), 0.3, 0.4, angle=30, alpha=0.2)
 45ax.add_artist(el)
 46ax.annotate("",
 47            xy=(x1, y1), xycoords='data',
 48            xytext=(x2, y2), textcoords='data',
 49            arrowprops=dict(arrowstyle="-", #linestyle="dashed",
 50                            color="0.5",
 51                            patchB=el,
 52                            shrinkB=0,
 53                            connectionstyle="arc3,rad=0.3",
 54                            ),
 55            )
 56
 57add_at(ax, "clip", loc=2)
 58
 59
 60ax = grid[2]
 61ax.plot([x1, x2], [y1, y2], ".")
 62el = mpatches.Ellipse((x1, y1), 0.3, 0.4, angle=30, alpha=0.2)
 63ax.add_artist(el)
 64ax.annotate("",
 65            xy=(x1, y1), xycoords='data',
 66            xytext=(x2, y2), textcoords='data',
 67            arrowprops=dict(arrowstyle="-", #linestyle="dashed",
 68                            color="0.5",
 69                            patchB=el,
 70                            shrinkB=5,
 71                            connectionstyle="arc3,rad=0.3",
 72                            ),
 73            )
 74
 75add_at(ax, "shrink", loc=2)
 76
 77
 78ax = grid[3]
 79ax.plot([x1, x2], [y1, y2], ".")
 80el = mpatches.Ellipse((x1, y1), 0.3, 0.4, angle=30, alpha=0.2)
 81ax.add_artist(el)
 82ax.annotate("",
 83            xy=(x1, y1), xycoords='data',
 84            xytext=(x2, y2), textcoords='data',
 85            arrowprops=dict(arrowstyle="fancy", #linestyle="dashed",
 86                            color="0.5",
 87                            patchB=el,
 88                            shrinkB=5,
 89                            connectionstyle="arc3,rad=0.3",
 90                            ),
 91            )
 92
 93add_at(ax, "mutate", loc=2)
 94
 95grid[0].set_xlim(0, 1)
 96grid[0].set_ylim(0, 1)
 97grid[0].axis["bottom"].toggle(ticklabels=False)
 98grid[0].axis["left"].toggle(ticklabels=False)
 99fig.subplots_adjust(left=0.05, right=0.95, bottom=0.05, top=0.95)
100
101plt.draw()
102plt.show()
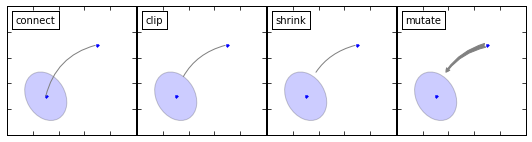
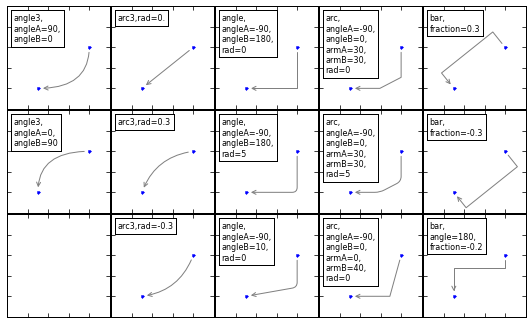
字典中,connectionstyle 参数控制路径的风格:
| Name | Attr |
|---|---|
| angle | angleA=90,angleB=0,rad=0.0 |
| angle3 | angleA=90,angleB=0 |
| arc | angleA=0,angleB=0,armA=None,armB=None,rad=0.0 |
| arc3 | rad=0.0 |
| bar | armA=0.0,armB=0.0,fraction=0.3,angle=None |
  1import matplotlib.pyplot as plt
  2import matplotlib.patches as mpatches
  3
  4fig = plt.figure(1, figsize=(8,5))
  5fig.clf()
  6from mpl_toolkits.axes_grid.axes_grid import AxesGrid
  7from mpl_toolkits.axes_grid.anchored_artists import AnchoredText
  8
  9#from matplotlib.font_manager import FontProperties
 10
 11def add_at(ax, t, loc=2):
 12    fp = dict(size=8)
 13    _at = AnchoredText(t, loc=loc, prop=fp)
 14    ax.add_artist(_at)
 15    return _at
 16
 17
 18grid = AxesGrid(fig, 111, (3, 5), label_mode="1", share_all=True)
 19
 20grid[0].set_autoscale_on(False)
 21
 22
 23x1, y1 = 0.3, 0.3
 24x2, y2 = 0.7, 0.7
 25
 26
 27def demo_con_style(ax, connectionstyle, label=None):
 28
 29    if label is None:
 30        label = connectionstyle
 31
 32    x1, y1 = 0.3, 0.2
 33    x2, y2 = 0.8, 0.6
 34
 35    ax.plot([x1, x2], [y1, y2], ".")
 36    ax.annotate("",
 37                xy=(x1, y1), xycoords='data',
 38                xytext=(x2, y2), textcoords='data',
 39                arrowprops=dict(arrowstyle="->", #linestyle="dashed",
 40                                color="0.5",
 41                                shrinkA=5, shrinkB=5,
 42                                patchA=None,
 43                                patchB=None,
 44                                connectionstyle=connectionstyle,
 45                                ),
 46                )
 47
 48    add_at(ax, label, loc=2)
 49
 50column = grid.axes_column[0]
 51
 52demo_con_style(column[0], "angle3,angleA=90,angleB=0",
 53               label="angle3,\nangleA=90,\nangleB=0")
 54demo_con_style(column[1], "angle3,angleA=0,angleB=90",
 55               label="angle3,\nangleA=0,\nangleB=90")
 56
 57
 58
 59column = grid.axes_column[1]
 60
 61demo_con_style(column[0], "arc3,rad=0.")
 62demo_con_style(column[1], "arc3,rad=0.3")
 63demo_con_style(column[2], "arc3,rad=-0.3")
 64
 65
 66
 67column = grid.axes_column[2]
 68
 69demo_con_style(column[0], "angle,angleA=-90,angleB=180,rad=0",
 70               label="angle,\nangleA=-90,\nangleB=180,\nrad=0")
 71demo_con_style(column[1], "angle,angleA=-90,angleB=180,rad=5",
 72               label="angle,\nangleA=-90,\nangleB=180,\nrad=5")
 73demo_con_style(column[2], "angle,angleA=-90,angleB=10,rad=5",
 74               label="angle,\nangleA=-90,\nangleB=10,\nrad=0")
 75
 76
 77column = grid.axes_column[3]
 78
 79demo_con_style(column[0], "arc,angleA=-90,angleB=0,armA=30,armB=30,rad=0",
 80               label="arc,\nangleA=-90,\nangleB=0,\narmA=30,\narmB=30,\nrad=0")
 81demo_con_style(column[1], "arc,angleA=-90,angleB=0,armA=30,armB=30,rad=5",
 82               label="arc,\nangleA=-90,\nangleB=0,\narmA=30,\narmB=30,\nrad=5")
 83demo_con_style(column[2], "arc,angleA=-90,angleB=0,armA=0,armB=40,rad=0",
 84               label="arc,\nangleA=-90,\nangleB=0,\narmA=0,\narmB=40,\nrad=0")
 85
 86
 87column = grid.axes_column[4]
 88
 89demo_con_style(column[0], "bar,fraction=0.3",
 90               label="bar,\nfraction=0.3")
 91demo_con_style(column[1], "bar,fraction=-0.3",
 92               label="bar,\nfraction=-0.3")
 93demo_con_style(column[2], "bar,angle=180,fraction=-0.2",
 94               label="bar,\nangle=180,\nfraction=-0.2")
 95
 96
 97#demo_con_style(column[1], "arc3,rad=0.3")
 98#demo_con_style(column[2], "arc3,rad=-0.3")
 99
100
101grid[0].set_xlim(0, 1)
102grid[0].set_ylim(0, 1)
103grid.axes_llc.axis["bottom"].toggle(ticklabels=False)
104grid.axes_llc.axis["left"].toggle(ticklabels=False)
105fig.subplots_adjust(left=0.05, right=0.95, bottom=0.05, top=0.95)
106
107plt.draw()
108plt.show()
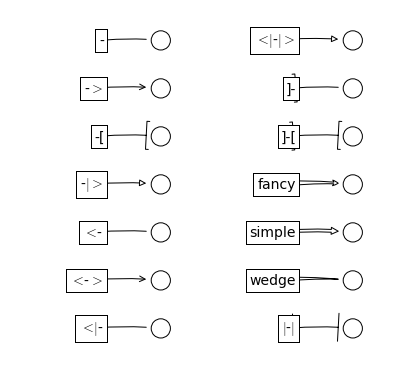
arrowstyle 参数控制小箭头的风格:
| Name | Attrs |
|---|---|
- |
None |
-> |
head_length=0.4,head_width=0.2 |
-[ |
widthB=1.0,lengthB=0.2,angleB=None |
¦-¦ |
widthA=1.0,widthB=1.0 |
-¦> |
head_length=0.4,head_width=0.2 |
<- |
head_length=0.4,head_width=0.2 |
<-> |
head_length=0.4,head_width=0.2 |
<¦- |
head_length=0.4,head_width=0.2 |
<¦-¦> |
head_length=0.4,head_width=0.2 |
fancy |
head_length=0.4,head_width=0.4,tail_width=0.4 |
simple |
head_length=0.5,head_width=0.5,tail_width=0.2 |
wedge |
tail_width=0.3,shrink_factor=0.5 |
 1import matplotlib.patches as mpatches
 2import matplotlib.pyplot as plt
 3
 4styles = mpatches.ArrowStyle.get_styles()
 5
 6ncol=2
 7nrow = (len(styles)+1) // ncol
 8figheight = (nrow+0.5)
 9fig1 = plt.figure(1, (4.*ncol/1.5, figheight/1.5))
10fontsize = 0.2 * 70
11
12
13ax = fig1.add_axes([0, 0, 1, 1], frameon=False, aspect=1.)
14
15ax.set_xlim(0, 4*ncol)
16ax.set_ylim(0, figheight)
17
18def to_texstring(s):
19    s = s.replace("<", r"$<$")
20    s = s.replace(">", r"$>$")
21    s = s.replace("|", r"$|$")
22    return s
23
24for i, (stylename, styleclass) in enumerate(sorted(styles.items())):
25    x = 3.2 + (i//nrow)*4
26    y = (figheight - 0.7 - i%nrow) # /figheight
27    p = mpatches.Circle((x, y), 0.2, fc="w")
28    ax.add_patch(p)
29
30    ax.annotate(to_texstring(stylename), (x, y),
31                (x-1.2, y),
32                #xycoords="figure fraction", textcoords="figure fraction",
33                ha="right", va="center",
34                size=fontsize,
35                arrowprops=dict(arrowstyle=stylename,
36                                patchB=p,
37                                shrinkA=5,
38                                shrinkB=5,
39                                fc="w", ec="k",
40                                connectionstyle="arc3,rad=-0.05",
41                                ),
42                bbox=dict(boxstyle="square", fc="w"))
43
44ax.xaxis.set_visible(False)
45ax.yaxis.set_visible(False)
46
47
48
49plt.draw()
50plt.show()