06.05 图像基础
图像基础
导入相应的包:
1import matplotlib.pyplot as plt
2import matplotlib.image as mpimg
3import numpy as np
4%matplotlib inline

导入图像
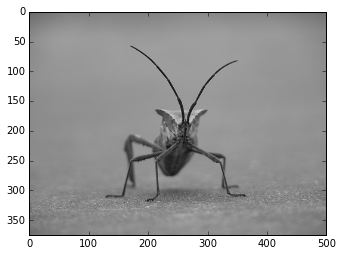
我们首先导入上面的图像,注意 matplotlib 默认只支持 PNG 格式的图像,我们可以使用 mpimg.imread 方法读入这幅图像:
1img = mpimg.imread('stinkbug.png')
1img.shape
(375L, 500L, 3L)
这是一个 375 x 500 x 3 的 RGB 图像,并且每个像素使用 uint8 分别表示 RGB 三个通道的值。不过在处理的时候,matplotlib 将它们的值归一化到 0.0~1.0 之间:
1img.dtype
dtype('float32')
显示图像
使用 plt.imshow() 可以显示图像:
1imgplot = plt.imshow(img)
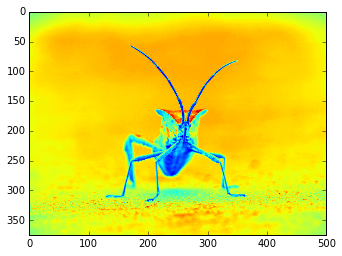
伪彩色图像
从单通道模拟彩色图像:
1lum_img = img[:,:,0]
2imgplot = plt.imshow(lum_img)
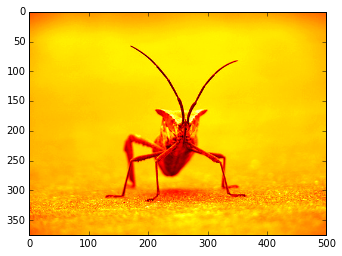
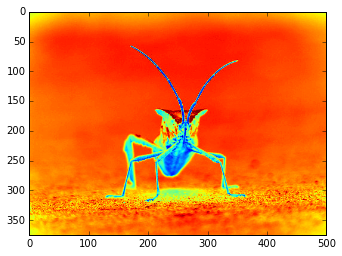
改变 colormap
1imgplot = plt.imshow(lum_img)
2imgplot.set_cmap('hot')
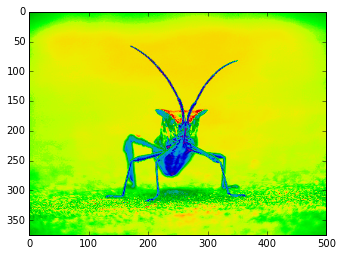
1imgplot = plt.imshow(lum_img)
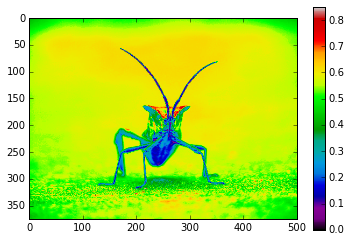
2imgplot.set_cmap('spectral')
显示色度条:
1imgplot = plt.imshow(lum_img)
2imgplot.set_cmap('spectral')
3plt.colorbar()
4plt.show()
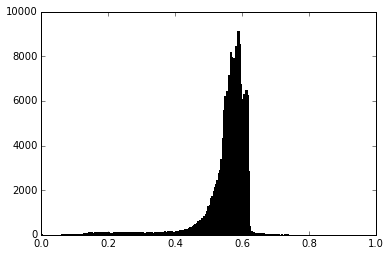
限制显示范围
先查看直方图:
1plt.hist(lum_img.flatten(), 256, range=(0.0,1.0), fc='k', ec='k')
2plt.show()
将显示范围设为 0.0-0.7:
1imgplot = plt.imshow(lum_img)
2imgplot.set_clim(0.0,0.7)
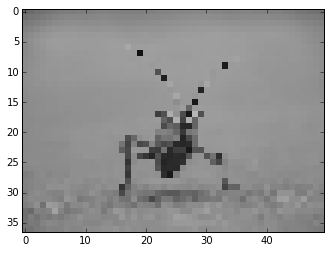
resize 操作
1from PIL import Image
2img = Image.open('stinkbug.png')
3rsize = img.resize((img.size[0]/10,img.size[1]/10))
4rsizeArr = np.asarray(rsize)
5imgplot = plt.imshow(rsizeArr)

上面我们将这个图像使用 PIL 的 Image 对象导入,并将其 resize 为原来的 1/100,可以看到很多细节都丢失了。
在画图时,由于画面的大小与实际像素的大小可能不一致,所以不一致的地方会进行插值处理,尝试一下不同的插值方法:
1imgplot = plt.imshow(rsizeArr)
2imgplot.set_interpolation('nearest')
1imgplot = plt.imshow(rsizeArr)
2imgplot.set_interpolation('bicubic')
