06.03 处理文本(基础)
处理文本(基础)
1import matplotlib.pyplot as plt
2import numpy as np
3%matplotlib inline
matplotlib 对文本的支持十分完善,包括数学公式,Unicode 文字,栅格和向量化输出,文字换行,文字旋转等一系列操作。
基础文本函数
在 matplotlib.pyplot 中,基础的文本函数如下:
text()在Axes对象的任意位置添加文本xlabel()添加 x 轴标题ylabel()添加 y 轴标题title()给Axes对象添加标题figtext()在Figure对象的任意位置添加文本suptitle()给Figure对象添加标题anotate()给Axes对象添加注释(可选择是否添加箭头标记)
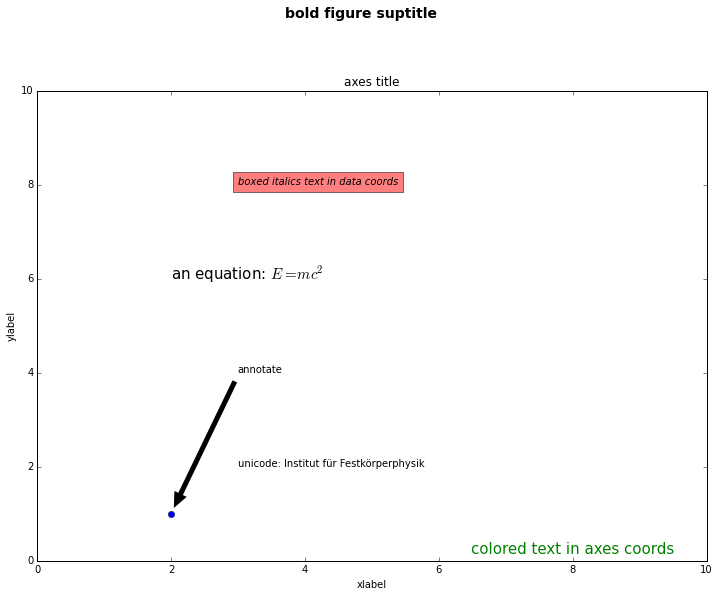
 1# -*- coding: utf-8 -*-
 2import matplotlib.pyplot as plt
 3%matplotlib inline
 4
 5# plt.figure() 返回一个 Figure() 对象
 6fig = plt.figure(figsize=(12, 9))
 7
 8# 设置这个 Figure 对象的标题
 9# 事实上,如果我们直接调用 plt.suptitle() 函数,它会自动找到当前的 Figure 对象
10fig.suptitle('bold figure suptitle', fontsize=14, fontweight='bold')
11
12# Axes 对象表示 Figure 对象中的子图
13# 这里只有一幅图像,所以使用 add_subplot(111)
14ax = fig.add_subplot(111)
15fig.subplots_adjust(top=0.85)
16
17# 可以直接使用 set_xxx 的方法来设置标题
18ax.set_title('axes title')
19# 也可以直接调用 title(),因为会自动定位到当前的 Axes 对象
20# plt.title('axes title')
21
22ax.set_xlabel('xlabel')
23ax.set_ylabel('ylabel')
24
25# 添加文本,斜体加文本框
26ax.text(3, 8, 'boxed italics text in data coords', style='italic',
27        bbox={'facecolor':'red', 'alpha':0.5, 'pad':10})
28
29# 数学公式,用 $$ 输入 Tex 公式
30ax.text(2, 6, r'an equation: $E=mc^2$', fontsize=15)
31
32# Unicode 支持
33ax.text(3, 2, unicode('unicode: Institut f\374r Festk\366rperphysik', 'latin-1'))
34
35# 颜色,对齐方式
36ax.text(0.95, 0.01, 'colored text in axes coords',
37        verticalalignment='bottom', horizontalalignment='right',
38        transform=ax.transAxes,
39        color='green', fontsize=15)
40
41# 注释文本和箭头
42ax.plot([2], [1], 'o')
43ax.annotate('annotate', xy=(2, 1), xytext=(3, 4),
44            arrowprops=dict(facecolor='black', shrink=0.05))
45
46# 设置显示范围
47ax.axis([0, 10, 0, 10])
48
49plt.show()
文本属性和布局
我们可以通过下列关键词,在文本函数中设置文本的属性:
| 关键词 | 值 |
|---|---|
| alpha | float |
| backgroundcolor | any matplotlib color |
| bbox | rectangle prop dict plus key 'pad' which is a pad in points |
| clip_box | a matplotlib.transform.Bbox instance |
| clip_on | [True , False] |
| clip_path | a Path instance and a Transform instance, a Patch |
| color | any matplotlib color |
| family | [ 'serif' , 'sans-serif' , 'cursive' , 'fantasy' , 'monospace' ] |
| fontproperties | a matplotlib.font_manager.FontProperties instance |
| horizontalalignment or ha | [ 'center' , 'right' , 'left' ] |
| label | any string |
| linespacing | float |
| multialignment | ['left' , 'right' , 'center' ] |
| name or fontname | string e.g., ['Sans' , 'Courier' , 'Helvetica' ...] |
| picker | [None,float,boolean,callable] |
| position | (x,y) |
| rotation | [ angle in degrees 'vertical' , 'horizontal' |
| size or fontsize | [ size in points , relative size, e.g., 'smaller', 'x-large' ] |
| style or fontstyle | [ 'normal' , 'italic' , 'oblique'] |
| text | string or anything printable with '%s' conversion |
| transform | a matplotlib.transform transformation instance |
| variant | [ 'normal' , 'small-caps' ] |
| verticalalignment or va | [ 'center' , 'top' , 'bottom' , 'baseline' ] |
| visible | [True , False] |
| weight or fontweight | [ 'normal' , 'bold' , 'heavy' , 'light' , 'ultrabold' , 'ultralight'] |
| x | float |
| y | float |
| zorder | any number |
其中 va, ha, multialignment 可以用来控制布局。
horizontalalignmentorha:x 位置参数表示的位置verticalalignmentorva:y 位置参数表示的位置multialignment:多行位置控制
 1import matplotlib.pyplot as plt
 2import matplotlib.patches as patches
 3
 4# build a rectangle in axes coords
 5left, width = .25, .5
 6bottom, height = .25, .5
 7right = left + width
 8top = bottom + height
 9
10fig = plt.figure(figsize=(10,7))
11ax = fig.add_axes([0,0,1,1])
12
13# axes coordinates are 0,0 is bottom left and 1,1 is upper right
14p = patches.Rectangle(
15    (left, bottom), width, height,
16    fill=False, transform=ax.transAxes, clip_on=False
17    )
18
19ax.add_patch(p)
20
21ax.text(left, bottom, 'left top',
22        horizontalalignment='left',
23        verticalalignment='top',
24        transform=ax.transAxes,
25        size='xx-large')
26
27ax.text(left, bottom, 'left bottom',
28        horizontalalignment='left',
29        verticalalignment='bottom',
30        transform=ax.transAxes,
31        size='xx-large')
32
33ax.text(right, top, 'right bottom',
34        horizontalalignment='right',
35        verticalalignment='bottom',
36        transform=ax.transAxes,
37        size='xx-large')
38
39ax.text(right, top, 'right top',
40        horizontalalignment='right',
41        verticalalignment='top',
42        transform=ax.transAxes,
43        size='xx-large')
44
45ax.text(right, bottom, 'center top',
46        horizontalalignment='center',
47        verticalalignment='top',
48        transform=ax.transAxes,
49        size='xx-large')
50
51ax.text(left, 0.5*(bottom+top), 'right center',
52        horizontalalignment='right',
53        verticalalignment='center',
54        rotation='vertical',
55        transform=ax.transAxes,
56        size='xx-large')
57
58ax.text(left, 0.5*(bottom+top), 'left center',
59        horizontalalignment='left',
60        verticalalignment='center',
61        rotation='vertical',
62        transform=ax.transAxes,
63        size='xx-large')
64
65ax.text(0.5*(left+right), 0.5*(bottom+top), 'middle',
66        horizontalalignment='center',
67        verticalalignment='center',
68        fontsize=20, color='red',
69        transform=ax.transAxes)
70
71ax.text(right, 0.5*(bottom+top), 'centered',
72        horizontalalignment='center',
73        verticalalignment='center',
74        rotation='vertical',
75        transform=ax.transAxes,
76        size='xx-large')
77
78ax.text(left, top, 'rotated\nwith newlines',
79        horizontalalignment='center',
80        verticalalignment='center',
81        rotation=45,
82        transform=ax.transAxes,
83        size='xx-large')
84
85ax.set_axis_off()
86plt.show()
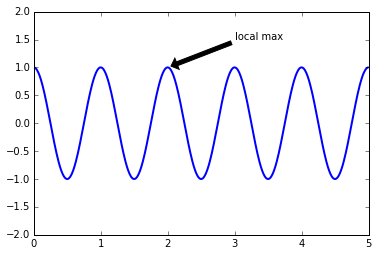
注释文本
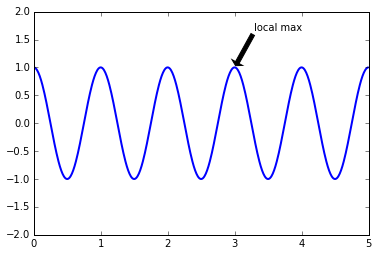
text() 函数在 Axes 对象的指定位置添加文本,而 annotate() 则是对某一点添加注释文本,需要考虑两个位置:一是注释点的坐标 xy ,二是注释文本的位置坐标 xytext:
 1fig = plt.figure()
 2ax = fig.add_subplot(111)
 3
 4t = np.arange(0.0, 5.0, 0.01)
 5s = np.cos(2*np.pi*t)
 6line, = ax.plot(t, s, lw=2)
 7
 8ax.annotate('local max', xy=(2, 1), xytext=(3, 1.5),
 9            arrowprops=dict(facecolor='black', shrink=0.05),
10            )
11
12ax.set_ylim(-2,2)
13plt.show()
在上面的例子中,两个左边使用的都是原始数据的坐标系,不过我们还可以通过 xycoords 和 textcoords 来设置坐标系(默认是 'data'):
| 参数 | 坐标系 |
|---|---|
| ‘figure points’ | points from the lower left corner of the figure |
| ‘figure pixels’ | pixels from the lower left corner of the figure |
| ‘figure fraction’ | 0,0 is lower left of figure and 1,1 is upper right |
| ‘axes points’ | points from lower left corner of axes |
| ‘axes pixels’ | pixels from lower left corner of axes |
| ‘axes fraction’ | 0,0 is lower left of axes and 1,1 is upper right |
| ‘data’ | use the axes data coordinate system |
使用一个不同的坐标系:
 1fig = plt.figure()
 2ax = fig.add_subplot(111)
 3
 4t = np.arange(0.0, 5.0, 0.01)
 5s = np.cos(2*np.pi*t)
 6line, = ax.plot(t, s, lw=2)
 7
 8ax.annotate('local max', xy=(3, 1),  xycoords='data',
 9            xytext=(0.8, 0.95), textcoords='axes fraction',
10            arrowprops=dict(facecolor='black', shrink=0.05),
11            horizontalalignment='right', verticalalignment='top',
12            )
13
14ax.set_ylim(-2,2)
15plt.show()
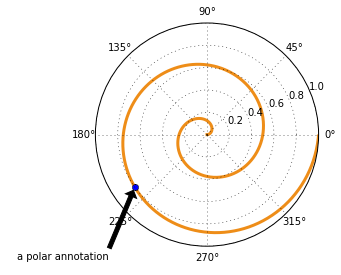
极坐标系注释文本
产生极坐标系需要在 subplot 的参数中设置 polar=True:
 1fig = plt.figure()
 2ax = fig.add_subplot(111, polar=True)
 3r = np.arange(0,1,0.001)
 4theta = 2*2*np.pi*r
 5line, = ax.plot(theta, r, color='#ee8d18', lw=3)
 6
 7ind = 800
 8thisr, thistheta = r[ind], theta[ind]
 9ax.plot([thistheta], [thisr], 'o')
10ax.annotate('a polar annotation',
11            xy=(thistheta, thisr),  # theta, radius
12            xytext=(0.05, 0.05),    # fraction, fraction
13            textcoords='figure fraction',
14            arrowprops=dict(facecolor='black', shrink=0.05),
15            horizontalalignment='left',
16            verticalalignment='bottom',
17            )
18plt.show()